This section provides in depth supporting information about the OvenSENTINEL™ System. |
|
|
Needs or requirements of the System. |
Statistical Process Control (SPC) Background Information The subset of SPC that is incorporated into OvenSENTINEL™ Software. |
|
What is it? How does it work? |
|
 Specifications
SENSORSZone Temperature Probe (Custom per Oven Make & Model):
Optical Board Entry and Exit:
Inductive Conveyor Speed:
PHYSICALStation:
DISPLAY / NOTIFICATIONStation:
Status Badge / Light Tower (Optional):
ENVIRONMENTAL LIMITATION SPECIFICATIONS
SOFTWARE REQUIREMENTS
|
||||||||||||||||||||||||||||||||||||||||||||||||||||||||||||||
TrueProfile™ KPI Measurements
TrueProfile™ detects the product entering the oven and tracks the board through the oven, collecting the temperatures of each oven zone, using the sensors in the oven’s zones, while the board is in each zone. If the temperature in a given zone is measured more than once, while a board is in that zone, the average of the two or more measurements are recorded for that zone. The same is true for the conveyor speed since it is measured multiple times while each board progress through the oven.
The product’s collection of zone temperatures (see Figure 1) and average conveyor speed measurements at the time the board is in each zone are the values used to predict the board's "TrueProfile™" and then extract the KPI measurements. These are the “TrueProfile™” KPI measurements. This is a superior method of performing the prediction because it records the actual zone temperatures over time, the time the board was actually in each zone, verses a snap shot at some instant in time. It also lets you pin point which board or boards truly failed the specifications rather than assuming ALL boards in the oven at the time of the snap shot failed.
Figure 1: Boards through the oven collect the zone temperatures while they are in each zone
|
.png)
Statistical Process Control (SPC) Background Information
This topic deals with the subset of SPC that is incorporated into software. It does not address general SPC principals. A working knowledge of general statistical principals and SPC terms is assumed and is not addressed here. There are many good basic SPC books such as the DataMyte Handbook where this information may be obtained.
Reflow operators, engineers and production managers are expected to understand their soldering process so as to deliver quality products cost effectively. This is a continuous process.
First, the machine must be checked for consistency. A standard or typical set up should be routinely checked prior to any process set point determinations, or actual production run machine checks. Only after the machine has been determined to be operating correctly and not experiencing abnormal variation, should data from the machine be utilized. SPC is all about identifying common or normal variation from abnormal variation.
Second, the correct process set points must be determined for a particular product. Utilizing the M.O.L.E.® Thermal Profiler, the correct set points for a particular product may be determined. These set points, if selected correctly and followed, should deliver the maximum throughput of quality product.
Third, the machine must consistently deliver the correctly determined set points. SPC will help identify common or normal variation from abnormal variation. Checking the machine using your M.O.L.E.® and the software with its SPC capability will help ensure that the machine is consistently performing to its set points and your expectations.
Fourth, repeat the above three steps. Continuous improvement is a never-ending cycle. Check the long-term variation of the machine by graphing typical set point samples. Using the M.O.L.E.®, recheck/adjust part number specific set points to maximize your quality throughput. Check the machine during a part number run to control the machine variation from that part number’s actual ideal set points.
While SPC had its start in high volume repetitive operations, SPC is applicable to many other types of operations as well. However, SPC can be difficult to apply to short runs. Short runs may be runs that take a long time to process, runs in which multiple samples are difficult to collect, and runs where samples are difficult to place into subgroups or runs where small quantities are run.
The software charts will be more meaningful to the user if SPC charts are generated based on data sets that have the same set points each time.
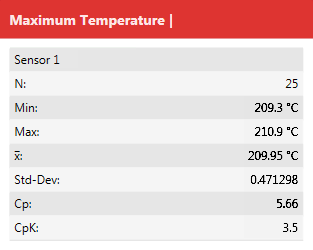
Process Capability A process capability index is a standard measure of how a process compares with its specification limits—how a process is performing relative to how it is supposed to perform. As opposed to the control chart, which shows detailed information about how the data compares with control limits, a capability index is a summary of how the data compares with the specification limits.
Two common capability indicators are Cp and Cpk. These values are shown in the Statistics Box on the SPC Workpace.
For both of the index values, the data used to determine them is dictated by the subgroup size (N) chosen by the user. In the case where N=1, individual data is used—for N>1, average data is used (x bar).
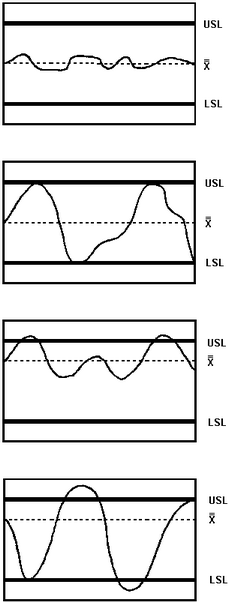
The charts on the next page give a graphical representation of the concept of Cp and Cpk. Notice that in each graph, the same upper and lower specification limits (USL, LSL) are used. The values of Cp and Cpk will differ according to the data that is compared with those specifications.
Depending on the particular process being monitored, the desired value for Cp and Cpk may differ. In general, however, a Cp and Cpk of 1.33 or above is desired. This assures that the process is not only capable of meeting the required specification limits, but also has a built-in margin for error that may be needed in special circumstances. In addition to targeting a certain minimum Cp and Cpk, it is also desirable to have these two values equal one another. This indicates that the process is well-centered between the specification limits.
The equations used to calculate the index values are as follows:
As can be interpreted from the above equations, Cp gives an indication of how narrow the data distribution is relative to the width of the specification limits. Essentially, it indicates how well the process would be able to stay within the specified limits if the data were perfectly centered between those limits.
Cpk compares the widest half of the data distribution to the appropriate specification limit. It indicates whether the process is capable of meeting the specification as indicated by the “worst half” of the measurements. Unlike Cp, the Cpk index measures process capability without assuming the data is well-centered.
|
.png)