When setting machine information, the user is required to select a machine. The software includes basic machine models for the user to select from. If your machine model does not appear in the list the software has the ability for you to create a new machine model.
|
This is available when in MAP is in Engineer Mode. View Menu>Mode>Engineer |
.png "Important Information")
To create a new machine:
| 1) | On the Machine menu, click Create New Machine. |
|
If the user has an existing machine (*.XMR) file they would like to use as a baseline, and is not listed in the Machine drop down list, it can be loaded/imported by selecting the Load command button. Once loaded, this new machine file will then appear in the machine drop down list for applying to new and existing data runs. |
.png "Tip")
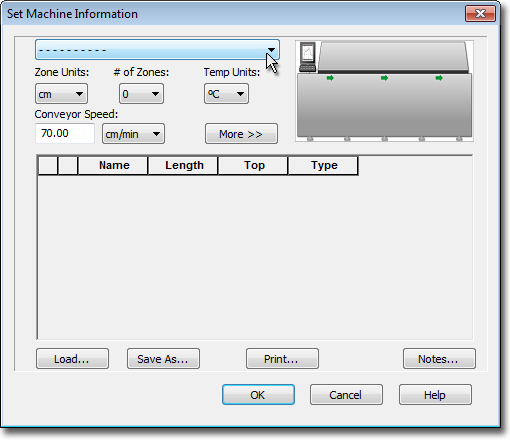
| 2) | Set the machine zone units. |
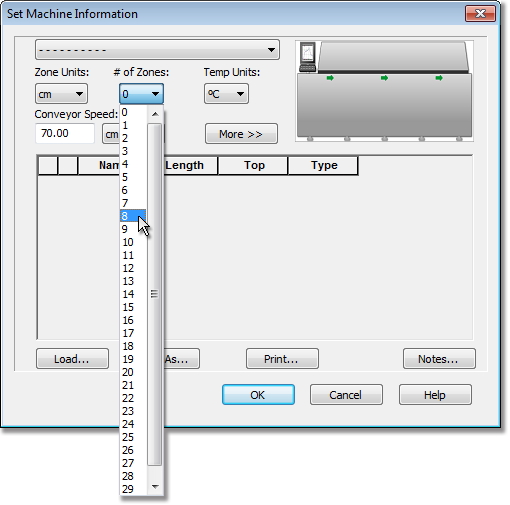
| 3) | Set the number of all machine zones (heating and cooling). |
| 4) | Set the machine temperature units. |
| 5) | Set the machine conveyor speed and units. The software uses this value to calculate the Time (X) Scale values when Distance units are displayed. This number is also used as the actual conveyor speed when prediction data lines are added. Refer to topic Prediction Tool for more information. |
|
To properly display a machine model on the Data Graph, a conveyor speed must be set. If you do not know what the conveyor speed is, the software allows you to estimate it based on the machine information and the data run profile. Refer to topic Estimate Conveyor Speed for more information. |
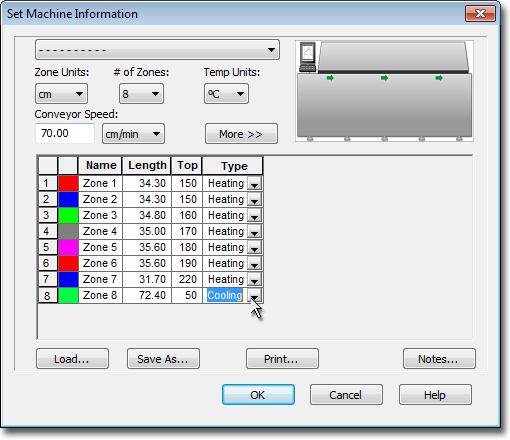
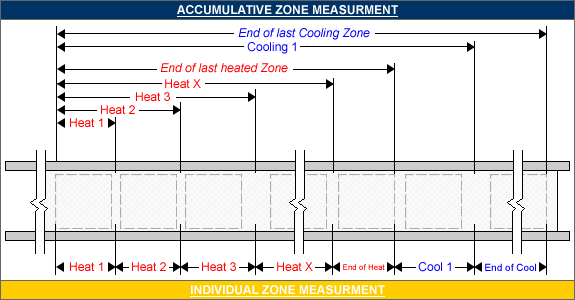
| 6) | In the machine zone matrix, set the zone names (descriptions), zone lengths, zone temperatures (top / bottom) and zone types (heating or cooling). |
|
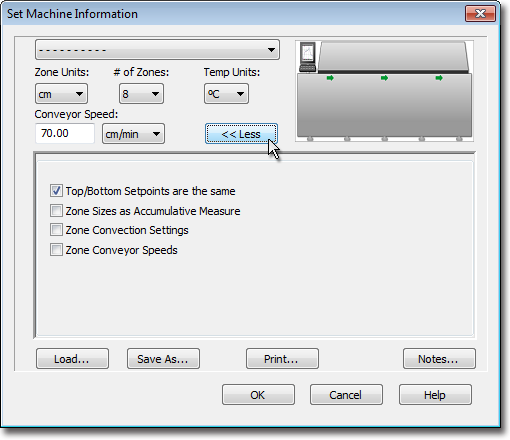
Additional machine zone settings can be configured by selecting the More command button. These are global settings that are applied to all data runs within the current Environment. When turning an option OFF such as Top and Bottom Setpoints are the same, this allows different setpoints for machine zone temperatures. This could be the upper and lower thresholds of acceptable temperatures to meet process standards or temperature settings of upper and lower heat sources. Upper zone temperatures appear as solid lines and lower zones appear as dotted lines on the Data Graph..
|
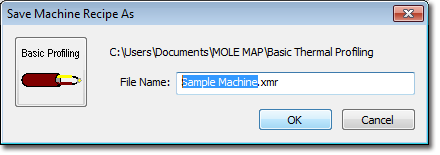
| 8) | Click the Save As command button to save the new machine (*.XMR) file in the current Environment, or Cancel to quit the command. |
|
The new machine now appears in the Machine drop-down list. Refer to topic Set Machine Information for additional information. |