M.O.L.E.® EV20 takes ECD’s novel touchscreen thermal profiler design to new levels. With 20 thermocouple inputs to enable expansive measurement precision for complex assemblies, M.O.L.E. EV20 is ideal for high-reliability, high-value PCBs used in mission-critical applications. Like all EV-generation touchscreen profilers, M.O.L.E. EV20 enables users to view process calculation templates, profiles, and pass/fail results directly on the device. Designed for ease-of-use, the thin, 20-channel profiler works with standard mini-connectors, has USB-C charging, and Bluetooth® wireless connectivity.

Features/functions:
•Touch screen display: Display allows user configuration, measurement and data analysis right on the device.
Screen: |
Description: |
|
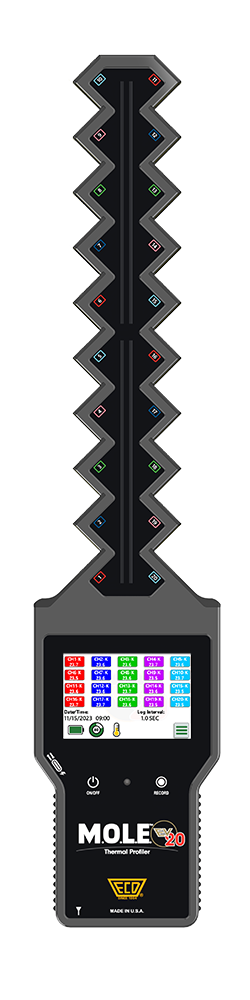
The default screen that is displayed when the thermal profiler is turned ON or when on a different screen times out.
This screen displays the status for: •Channel status (20): Shows channel number, sensor type and current temperature configured on the Channel type screen. These are dimmed if disabled and N/C if enabled with no sensor connected. •Date/Time: Current data and time configured on the Date/Time screen. Touch this to access the Date/Time screen. •Log interval: The interval the thermal profiler will take a reading when recording data. This is set on the Record configure screen. Touch this to access the Record configure screen. •Battery charge: Indicates remaining charge (0-100% displayed at 20% increments). •File storage: Indicates how full the storage is (0-100% at 10% increments). •Internal temperature: Symbol is Green if <=40°, Yellow if >40°C, <=70°C, Red if >70°C. |
|
|
Current sensor type for selected channel.
This screen displays: •Selected channel: Includes channel number and background color matches channel in KPI tables. •Channel/Sensor type: Supports K (default), J, T, E, N, R, S, B, and RH. |
|
|
Displayed after Record button is pressed. Screen turns OFF after 5 seconds unless connected to a PC with the USB-C cable.
This screen displays: •Channel status: Shows channel number and current temperature. •Record configure settings: Log interval, Start, End & Trigger. •Point count: Number of recorded data points for the active data run. |
|
|
Provides access to the top level screens. Touch a button to access the screen. All of the the screens return here.
This screen displays: •Record configure button •Select profile button •Select KPI button •Date/Time button •Units button •Bluetooth® button •Battery status button •History button •Factory settings button |
|
|
Current M.O.L.E. recording configuration settings. Touch a cell to edit. All settings are saved upon exiting the screen.
Record settings: •Log interval: Allows log settings of per second, seconds and minutes. Default is 1 second. •Start (optional): Set a recording start points delay from 1-9,999. Default is 0 (OFF). •End (optional): Set a recording end after logged points from 1-9,999. Default is 0 (OFF). •Trigger (optional): Set a threshold temperature that “triggers” the recording process when channel 1 reaches the specified temperature. |
|
|
Displays a List of Profiles for user to select and view. Touch to select. Arrow up/down to scroll list.
This screen displays: •Profile button: Touch to display the selected Profile. •KPI button: Touch to display the KPI table screen for selected profile. |
|
|
Displays a list of stored OK Specs downloaded from MAP Software. Touch to select. Arrow up/down to scroll list. Highlighted is set as default for all data runs. |
|
|
Current M.O.L.E. date and time settings. Touch a cell to edit. All settings are saved upon exiting the screen. These settings are automatically updated if configuring the M.O.L.E. with MAP software.
Record settings: •Month: 1-12 •Day: 1-31 •Year: >2021 •Time: hh:ss (24 hour) •Format: MM/DD/YYYY, DD/MM/YYYY or YYYY/MM/DD |
|
|
Current unit settings. Touch a cell to edit. All settings are saved upon exiting the screen.
Unit settings: •Temp: °C or °F •Time: Seconds (default), minutes or hours •Slope: °/sec (default) or °/min. |
|
|
Current Bluetooth® status. Touch a cell to edit. All settings are saved upon exiting the screen.
Settings: •Status: OFF or ON •Connection: Paired or Unpaired |
|
|
Current status of the battery:
This screen displays •Replaced: Battery last changed date •Charge: Current battery charge level (5% resolution) |
|
|
Displays the history of the thermal profiler.
This screen displays: •Over Temps: Count of the times the internal temperature of the thermal profiler has been over the maximum operational temperature of 80°C (176°F). •Max(imum) Temp: The highest recorded internal temperature the thermal profiler has been exposed to. •Runs: The amount of runs the thermal profiler has recorded. |
|
|
Displays current values for the factory settings. The firmware and serial number are a reference. Touch a cell to edit. All settings are saved upon exiting the screen.
Factory settings: •Language: English (default) •Cal(ibration) interval: Can be set to 6, 12, 18 or 24 months •Backlite: Sets the screen brightness (25-100% at 25% increments) •Delete all button: Deletes all of the thermal profiles (data runs). •Calibration button: Invokes the calibration process. |
|


•Control Buttons:
|
Displays Main Menu |
|
Returns to the previous screen. |
|
Approves user set value(s) and returns to the previous screen. |
|
Moves increments a user entered value or scrolls the screen up. |
|
Moves decrements a user entered value or scrolls the screen down. |
|
Scrolls to the top of a list or the screen. |
|
Deletes a selected data run or KPI file. |


•Thermocouple/Inputs:The inputs are where thermocouples and optional sensors are connected.
•Data/Charging Port: This port is located on the left side of the M.O.L.E. thermal profiler. This is used to transfer data through a USB-C to USB-A computer Interface cable to the computer and charge the internal Power Pack.
•Wireless Antenna Connector: The connection for the optional antenna for Bluetooth real-time communication.
•Buttons: ON/OFF & Record.
Button: |
Action: |
ON/OFF |
Turns M.O.L.E. thermal profiler "ON/OFF". |
Record |
Starts/Stops M.O.L.E. thermal profiler recording data. |
•Activity Indicator: These are LED's that indicate what state the M.O.L.E.® EV20 thermal profiler is in. Refer to the illustration and table below.
LED Color: |
Solid: |
Flashing |
|
||
Green |
Indicates M.O.L.E. thermal profiler is "ON" and idle |
|
Indicates M.O.L.E. thermal profiler is recording data. (Log Interval: 1 sec., flash each log, < 0.5 sec., flash 4 times per sec., > 1 sec., flash every 2 seconds) |
|
|
Red |
- |
|
Flashes 5 times to indicate when the internal battery voltage is low or internal temp is at or above a threshold or all channels are OFF or when the memory is full |
|
|
Yellow |
Power ON. LED illuminated for 3 seconds during system check |
|
- |
|
|
Wireless communication connection established |
|
Indicates when unit and transceiver is transferring data |
|
||
.png)
.png)
.png)
.png)
.png)
.png)
.png)