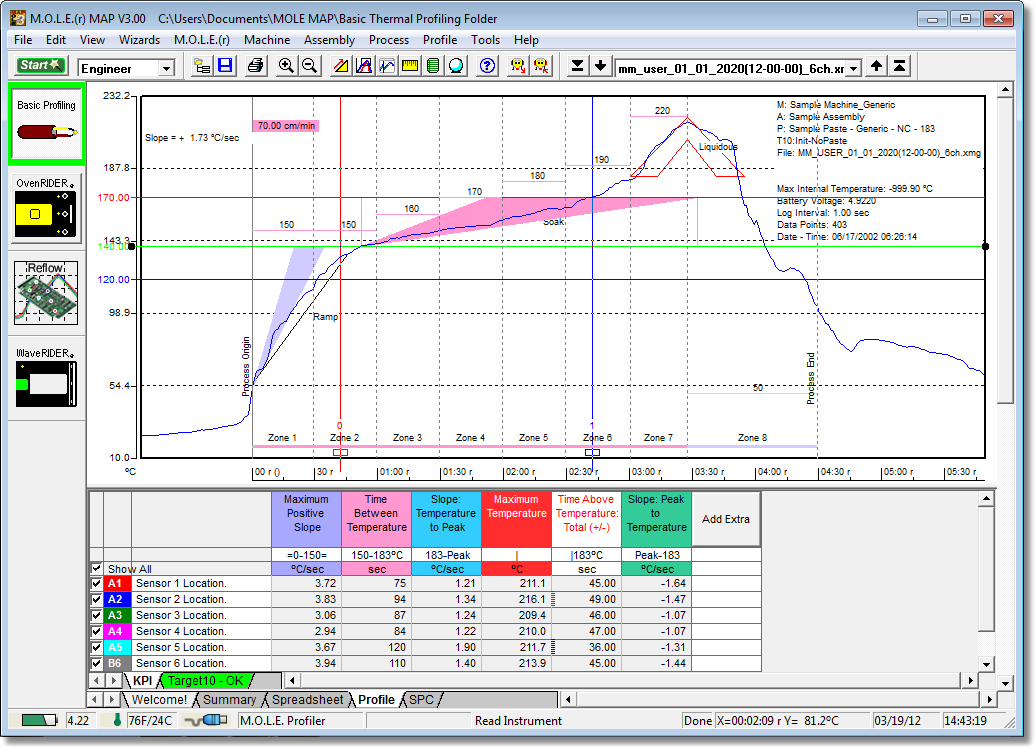
The Slope tool finds the average slope between any two points in the Data Graph.
|
This is available when in MAP is in Engineer Mode. View Menu>Mode>Engineer |
.png "Important Information")
To find the average slope of a line:
| 1) | On the Tools menu, click Slope. |
| 2) | Position the mouse pointer at a point on the curve. |
| 3) | Press and hold the left mouse button. |
| 4) | Drag the pointer to the end of the desired slope line. |
| 5) | Release the left mouse button when the pointer is at the desired location. The software will draw a slope line on the Data Graph, and label the slope value. |
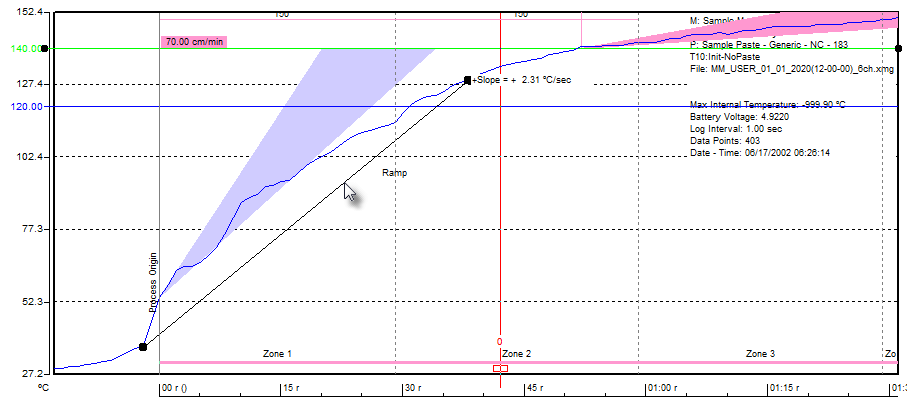
To obtain more accurate slopes:
| 1) | On the Tools menu, click Magnify to magnify a portion of the Data Graph |
| 2) | Repeat the Slope command. |
To remove a slope line from the Data Graph:
| 1) | Using the mouse pointer, select the object on the Data Graph by clicking it once. The object trackers will then become bold indicating that it has been selected. |
| 2) | Press the [Delete] key on the keyboard to remove the object. |
Slope Applications
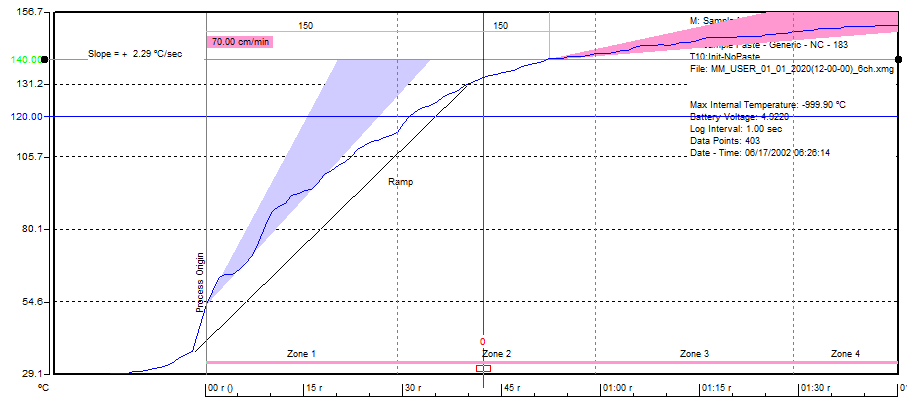
•Use the Slope tool to find the average slope between any two points on the graph. Longer slope lines tend to produce more accurate slope calculations.
•The Slope tool can be used to compare actual data with ideal conditions by drawing a line with a known slope (to represent the ideal condition) beside a portion of a Data Plot.
Slope Limitations
•Slope calculations are based on logged points connected by the slope line. Points occur only at the exact time intervals used to record data.
•The Slope tool cannot measure slopes when the line is vertical.
This command can be accessed on the Toolbar when the Profile Tab is active.
|
Slope Button |