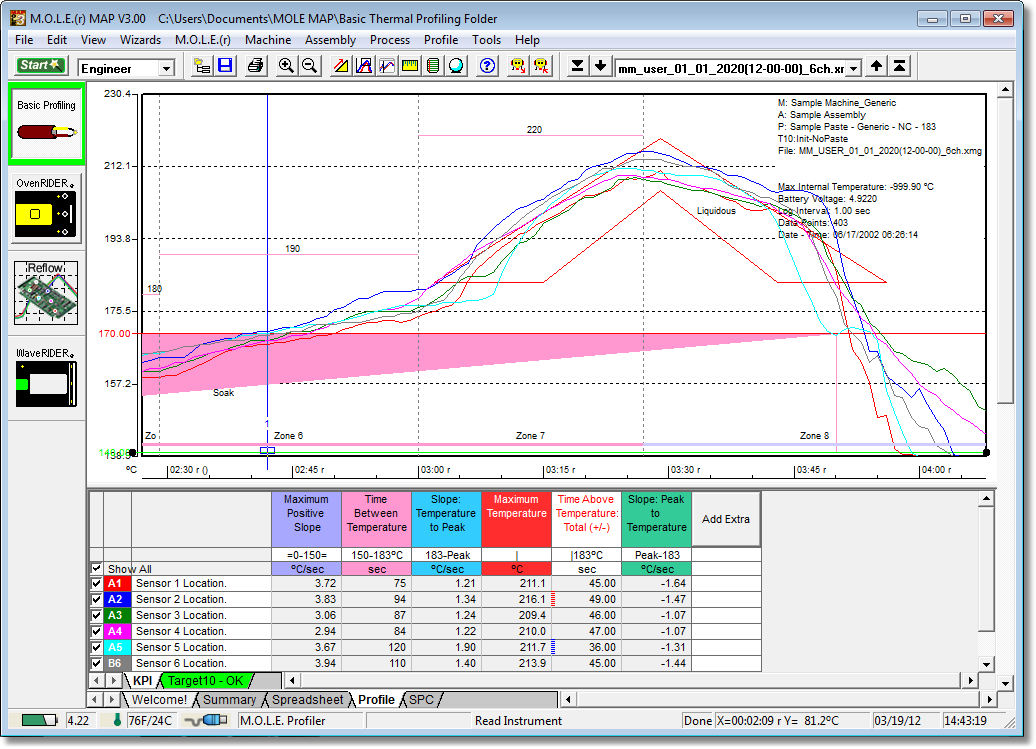
The Magnify tool enlarges any selected area of the data graph for easy visual examination.
|
This is available when in MAP is in Engineer Mode. View Menu>Mode>Engineer |
.png "Important Information")
To magnify a portion of the Data Graph:
|
When a Magnified Window constraint is applied to a parameter in the Data Table, the Magnify tool is used to enlarge a portion of the Data Graph, and the values within the magnified area are displayed in the Data Table. |
| 1) | On the Tools menu, point to Magnify then select Select Area. |
| 2) | Position the mouse pointer on a corner of the area to enlarge. |
| 3) | Press the left mouse button and drag the pointer diagonally to the opposite corner to form a box around the area to be magnified. An outline of the box appears as you drag. |
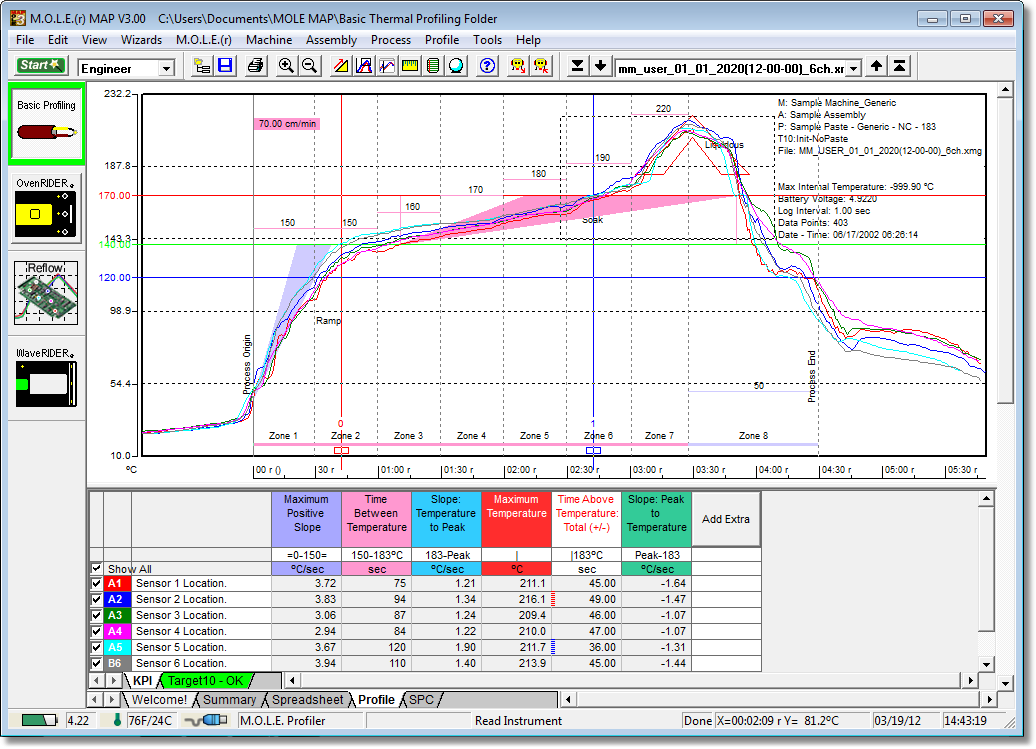
| 4) | Release the left mouse button when the outline of the area to be magnified is visible. The area inside the box is then magnified to fill the entire Data Graph. |
|
To show even more detail in the Data Graph, Magnify can be performed multiple times. If the Magnify tool reaches the maximum zoom capability the software will display a message box informing that the user has “Zoomed to Tight”. |
.png "Tip")
This command can be accessed on the Toolbar when the Profile Tab is active.
|
Magnify Button |