This Wizard guides the user through a typical process on how to set a M.O.L.E. Profiler up for performing a data run.
|
This is available when in MAP is in Engineer Mode. View Menu>Mode>Engineer |
.png "Important Information")
To set an instrument up:
| 1) | Start the software by double clicking on the program icon. |
| 2) | Connect the M.O.L.E. Profiler to the computer. Refer to the Communications Setup topic for your specific M.O.L.E. Profiler for more information. |
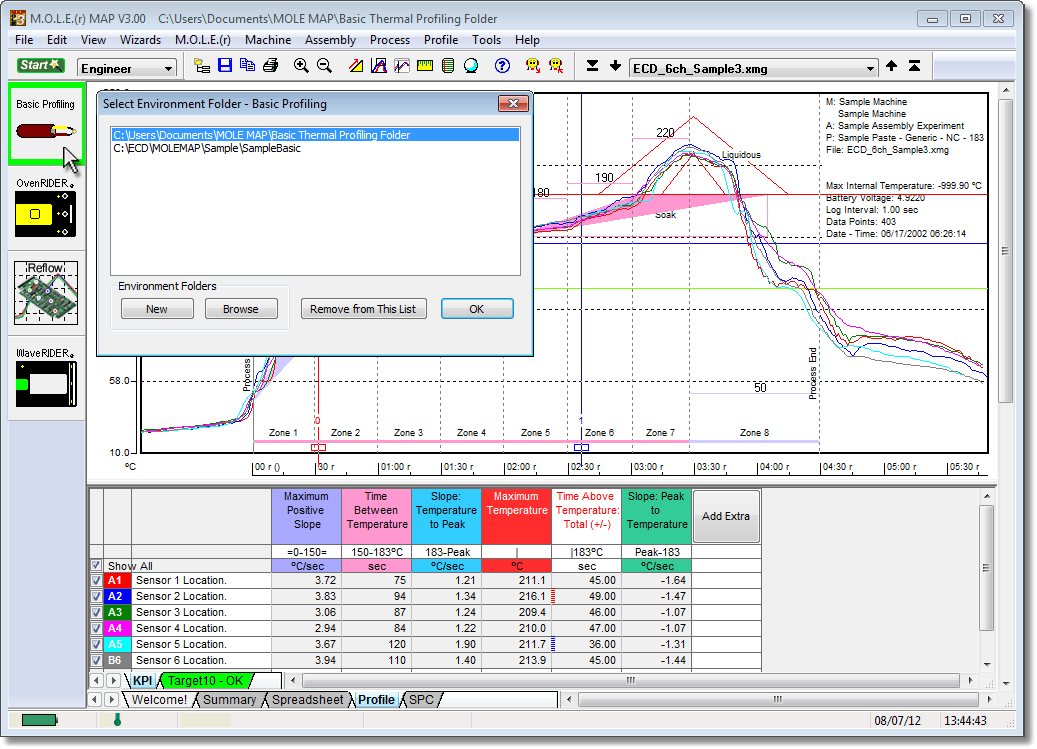
| 3) | Set an Environment related for the type of experiment that is being performed. Either open an existing Environment Folder or create a new one. |
|
If the desired Environment is not displayed on the Environment Sidebar, the user can enable it from the Preferences dialog. File Menu>Preferences>Misc Tab. |
| 4) | On the M.O.L.E. menu, click Setup Instrument and the workflow wizard appears. |
|
When navigating through the wizard, the step list on the left uses a color key to inform the user of the current step, steps that have been completed and remaining steps.
|
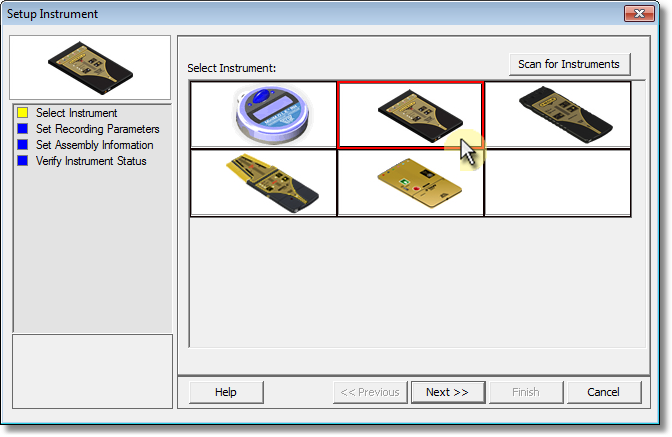
| 5) | Select the desired instrument from the dialog box to make active. If there are none listed, click the Scan for Instruments command button to detect all available instruments. |
|
If the software does not detect a M.O.L.E. thermal profiler, using the communication cable connect it to the computer and click the Scan for Instruments command button to search again. M.O.L.E.® MAP software allows multiple instruments to be connected to a computer at one time. Selecting the Scan for Instruments command button will detect all instruments and display them in the dialog box. If no instrument is detected the software displays all of the Demonstration thermal profilers to select from. |
| 6) | Click the Next command button. |
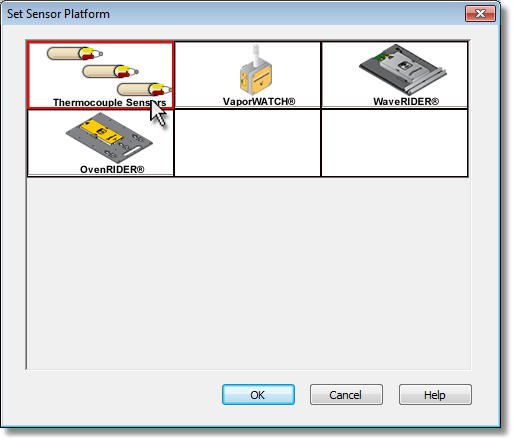
| 7) | Select the Sensor Platform button to select what type of sensor platform is to be used for the data run. |
|
The Sensor Platforms are displayed in the dialog box are also dependent on which Environment is currently selected and the M.O.L.E. thermal profiler it is compatible with. |
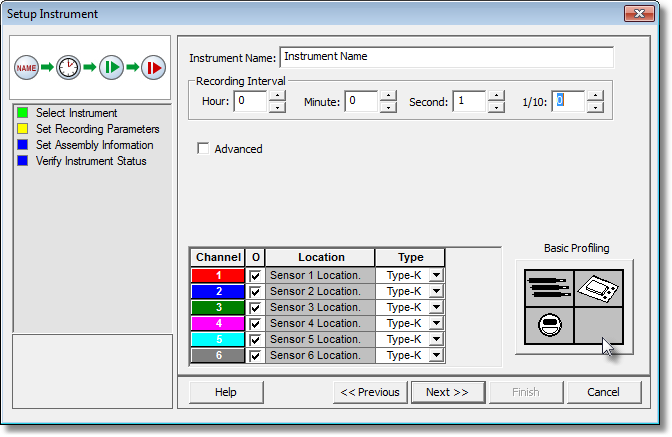
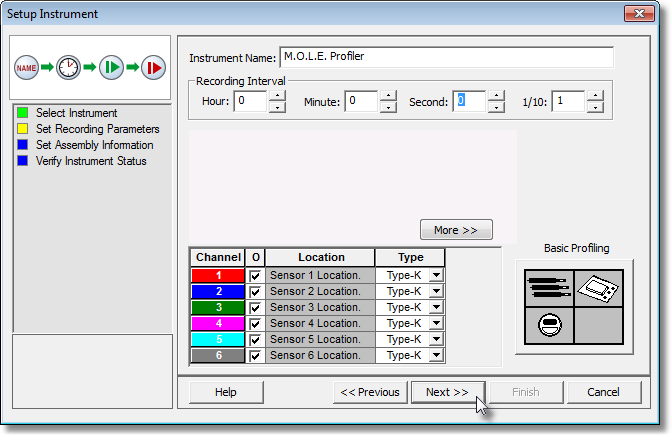
| 8) | Set instrument name and recording interval. This step is where the user can also turn a sensor channel ON or OFF, set the sensor location description and sensor type. |
|
For additional settings such as Start and Stop Parameters, select the More command button. Refer to topic Start and Stop Recording Parameters for detailed information for each setting. |
.png "Tip")
| 9) | Click the Next command button. |
|
When using the SuperM.O.L.E.™ Gold Profiler, the sending of data erases any currently stored data. |
| 10) | Set the assembly information such as part number, board size, sensor locations and a product image. This assembly information can then be loaded and saved from/to a an (*.XMA) file. |
•Load: This command buttons loads an existing assembly (*.XMA).
•Save: This command button saves the current sensor locations and image to an (*.XMA) file that is then available to be loaded for future data runs.
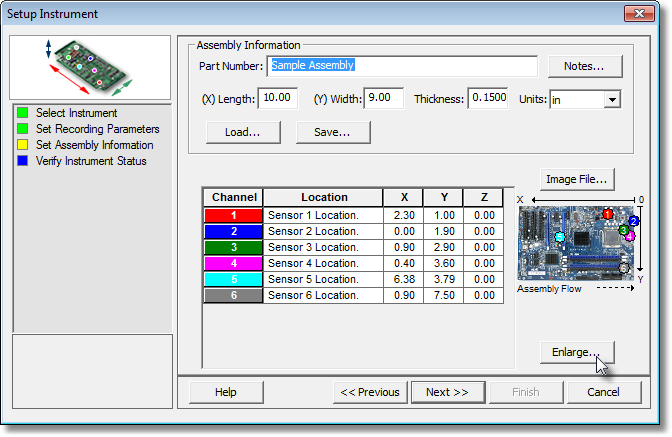
|
If a product image has been selected, clicking the Enlarge command button displays the Set Sensor Locations dialog box where the user can specify the locations of each sensor. To move sensor locations, drag the sensor markers to the approximate location where the sensors are attached. |
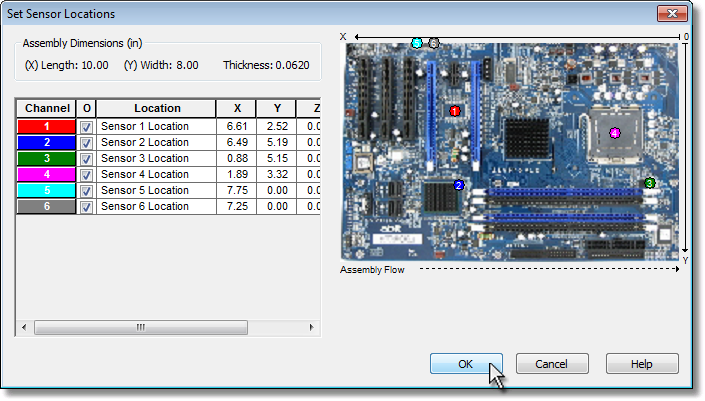
| 11) | When finished, click the OK command button to accept or Cancel to return without making any changes. |
| 12) | Click the Next command button. |
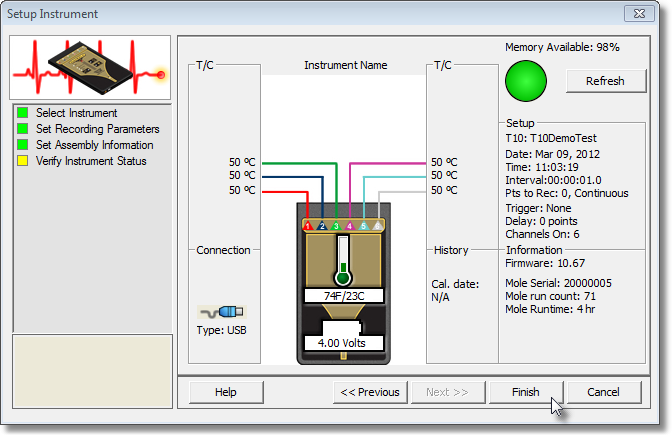
| 13) | Verify the instrument status. This dialog box displays the health of the M.O.L.E. Profiler such as Power Pack charge, internal temperature, thermocouple temperatures. |
|
If everything is OK, the dialog box displays a GREEN symbol. If there are any items that may prevent the user from collecting good data, they are highlighted and a yellow Warning symbol is displayed.
|
| 14) | Select the Finish command button to complete the Setup Instrument wizard. |
|
|
.gif "Visual Tutorial")