The following section will guide the user through a typical operation process. Portions of this section may require the referencing M.O.L.E. Profiler hardware and software sections for additional information.
Step 1: Setup Instrument
This Wizard guides the user through a typical process on how to set a M.O.L.E. Profiler up for performing a data run with the BreadOMETER® probe.
|
This is available when in MAP is in Engineer Mode. View Menu>Mode>Engineer |
.png "Important Information")
To set an instrument up:
| 1) | Connect the M.O.L.E. Profiler to the computer. Refer to the Communications Setup topic for your specific M.O.L.E. Profiler for more information. |
| 2) | Connect the BreadOMETER® probe to the M.O.L.E. Profiler. |
| 3) | Set an Environment related for the type of experiment that is being performed. Either open an existing Environment Folder or create a new one. |
|
If the desired Environment is not displayed on the Environment Sidebar, the user can enable it from the Preferences dialog. File Menu>Preferences>Misc Tab. |

| 4) | On the M.O.L.E. menu, click Setup Instrument and the workflow wizard appears. |
|
When navigating through the wizard, the step list on the left uses a color key to inform the user of the current step, steps that have been completed and remaining steps.
|
| 5) | Select the desired instrument from the dialog box. If there is none displayed, select the Scan for Instruments command button to detect all connected instruments. |
|
If the software does not detect a M.O.L.E. thermal profiler, using the communication cable connect it to the computer and click the Scan for Instruments command button to search again. M.O.L.E.® MAP software allows multiple instruments to be connected to a computer at one time. Selecting the Scan for Instruments command button will detect all instruments and display them in the dialog box. If no instrument is detected the software displays all of the Demonstration thermal profilers to select from. |

| 6) | Select the Next command button. |
| 7) | Set Instrument Name and then Sensor Platform button. |
|
For additional settings such as Start and Stop Parameters, select the Advanced check box. Refer to topic Start and Stop Recording Parameters for detailed information for each setting. |
.png "Tip")

| 8) | Select the BreadOMETER® probe sensor then the OK command button to proceed. |

| 9) | Confirm the sensor selection and then select the Next command button. |

|
When using the SuperM.O.L.E.™ Gold Profiler, the sending of data erases any currently stored data. |
| 10) | Select the Next command button to send the settings to the instrument. |

| 11) | Verify the instrument status. This dialog box displays the health of the M.O.L.E. Profiler such as battery charge, internal temperature, thermocouple temperatures. If the user selects the Show Critical command button the dialog box will only display items that will prevent the user from completing a successful data run. |
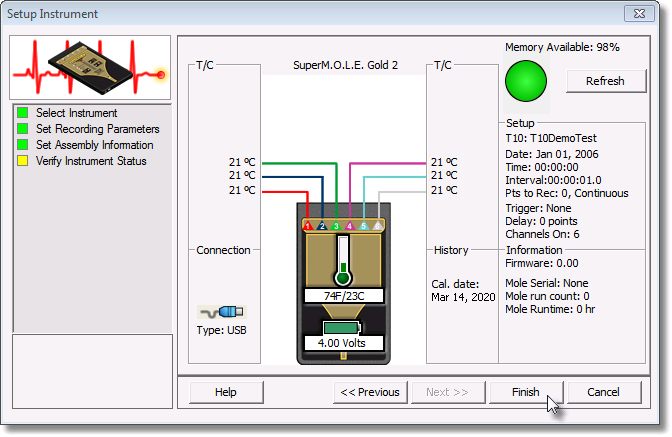
12) Select the Finish command button to complete the Setup Instrument wizard.
Step 2: Data Collection
|
Never permit the M.O.L.E. Profiler and BreadOMETER® probe to exceed the absolute maximum warranteed internal temperature, as permanent damage may result. The warranty will not cover damage caused by exceeding the maximum specified internal temperature. |
.png "Caution")
| 1) | Connect the M.O.L.E Profiler to the BreadOMETER® probe. |
.jpg)
| 2) | Press the M.O.L.E. Profiler "ON" button. |
| 3) | Place the M.O.L.E. Profiler in the appropriate Thermal Barrier and press the "Record" button. |
| 4) | Close the Thermal Barrier making sure the sensor wire does not get pinched. |
| 5) | Insert the BreadOMETER® probe into the test product. |
_zoom35.jpg)
| 6) | Pass the thermally protected M.O.L.E. Profiler and BreadOMETER® probe through the process. |
|
When retrieving the M.O.L.E. Profiler and sensor use caution as it may be warm. |
.png "Caution")
| 7) | As the M.O.L.E. and BreadOMETER® probe emerge from the process, remove it from the test product and lay the Thermal Barrier on a table or flat surface. |
_zoom35.jpg)
| 8) | Open the Thermal barrier and if the Record button is still flashing this means the M.O.L.E. Profiler is still logging and it should be stopped. |
|
When turning a BreadOMETER® “OFF”, do not release the button until the light goes off. Pressing the Start/Stop button briefly will restart the data collection process and erase all the data in memory. |
| 9) | Remove the M.O.L.E. Profiler from the Thermal Barrier and wait a few minutes for the M.O.L.E. Profiler to cool. Handle it carefully, as the case may still be warm. |
| 10) | Disconnect M.O.L.E. Profiler from the BreadOMETER® and place it near the PC that has the software installed on it. |
|
If you remove BreadOMETER® probe before the M.O.L.E. Profiler has stopped collecting data, it may cause the data to become distorted. |
Step 3: Download Data
| 1) | Connect the M.O.L.E. Profiler to the computer. Refer to the Communications Setup topic for your specific M.O.L.E. Profiler for more information. |
| 2) | Select the New (Start) button |
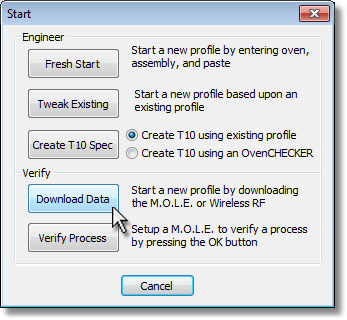
| 3) | On the Start dialog box, click the Download Data command button and the workflow wizard appears. |
|
When navigating through the wizard, the step list on the left uses a color key to inform the user of the current step, steps that have been completed and remaining steps.
|
| 4) | Select the instrument from the dialog box that was used with the BreadOMETER® probe. If a M.O.L.E. Profiler has already been selected during a different process, the software automatically selects the M.O.L.E. Profiler connected to the COM Port previously used. |
|
If the software does not detect a M.O.L.E. thermal profiler, using the communication cable connect it to the computer and click the Scan for Instruments command button to search again. M.O.L.E.® MAP software allows multiple instruments to be connected to a computer at one time. Selecting the Scan for Instruments command button will detect all instruments and display them in the dialog box. If no instrument is detected the software displays all of the Demonstration thermal profilers to select from. |

| 5) | Click the Next command button. |
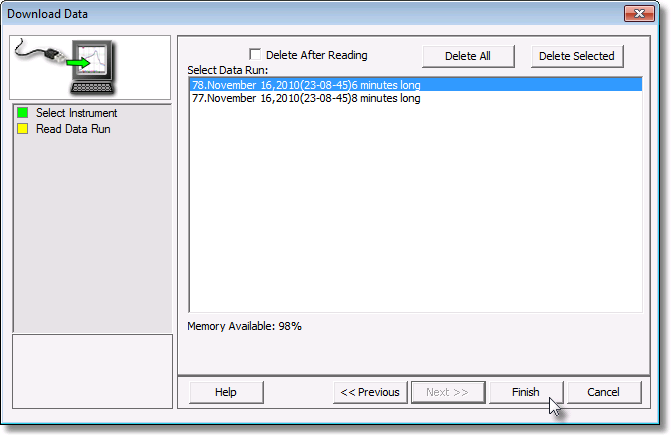
| 6) | Select the desired data run and then click the Finish command button to complete the wizard and read the data run from the M.O.L.E. Profiler. |
|
This step of the wizard allows the user to remove a selected data run from the M.O.L.E. Profiler by either selecting the Delete After Reading check box or selecting the Delete command button and removing it before downloading. This feature is not available for the SuperM.O.L.E.™ Gold Thermal Profiler as it does not have the ability to store more than one data run. |
|
The software allows the ability to download multiple data runs at one time. For consecutive data runs, click the first data run in the list, press and hold down the SHIFT key, and then click the last data run in the list. For data runs that are not consecutive, press and hold down the CTRL key, and then click each data run that you want to import. |
| 7) | When the data run has been downloaded, the software prompts the user to specify new file name (*.XMG). |
|
If a data run (*.XMG) is saved in a different Environment Folder other than the currently selected, the software automatically activates the new Environment Folder. This process does not delete any data run files in the previously set Environment Folder and can be quickly accessed using the Recent Environment Folders on the File menu. |
I
| 8) | When finished, click the Save command button to complete the process. |
The information is automatically saved in the data run file (.XMG) and the experiment data can now be analyzed with the software tools.