To add or edit Y-Axis Values content:
| 1) | Right-click a template cell and a shortcut menu appears. |
| 2) | Select Add Content or Edit Content from the shortcut menu and the Add or Change a Calculation wizard appears. |
|
When navigating through the wizard, the step list on the left uses a color key to inform the user of the current step, steps that have been completed and remaining steps.
|
.png "Important Information")
| 3) | Click Temperature Values (Y) and which channel to derive the data from. |
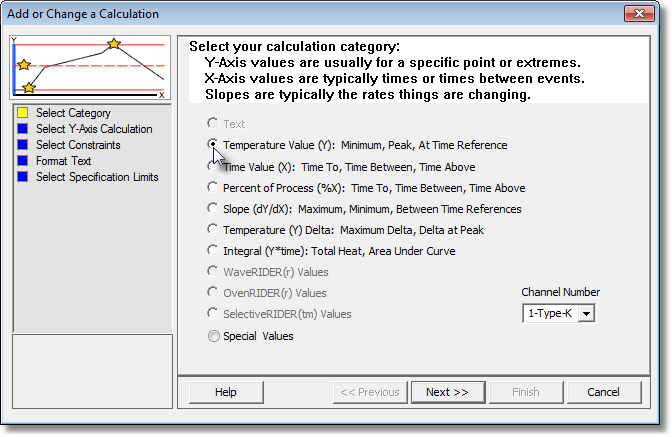
| 4) | Select the Next command button. |
| 5) | Select a Temperature (Y) Axis Value. |
|
If Temperature at Time Reference calculation is selected, the software requires the user to select an established Time (X) Reference line. If one is not established the software automatically creates one on the Profile Page Tab Data Graph. |
.png "Tip")
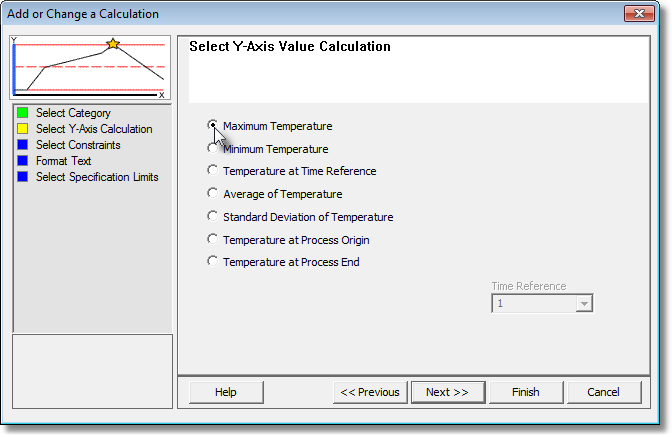
| 6) | Select the Next command button. |
| 7) | Select the calculation constraints. These options are the specified area on the Time (X) Axis where the values are to be extracted from. |
|
If the Within Magnified Window constraint is selected and the Magnify tool is used to zoom in on a portion of the Data Graph, the Data Table displays the statistics for those values within the magnified window. |
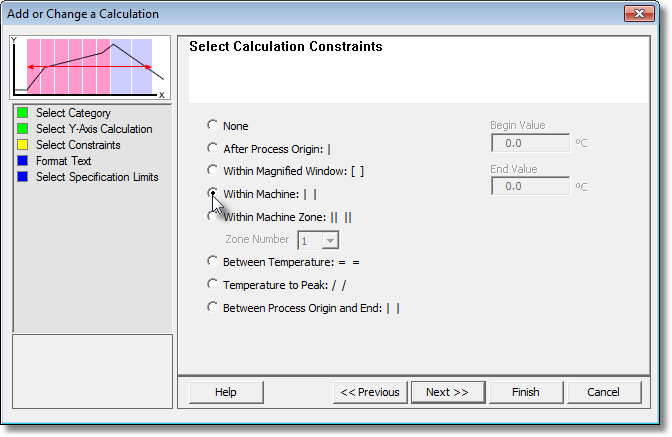
| 8) | Select the Next command button. |
| 9) | Select desired text formatting options. |
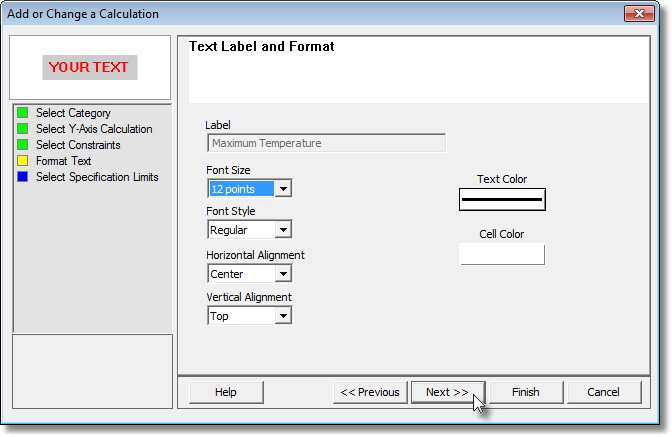
| 10) | Select the Next command button. |
| 11) | Select Specification Limits and Units. If these values are violated colored bars will appear in the formatted template cell. Refer to topic Software>Page Tabs>Spreadsheet>Template>Specification Limit Indicators for more information. |
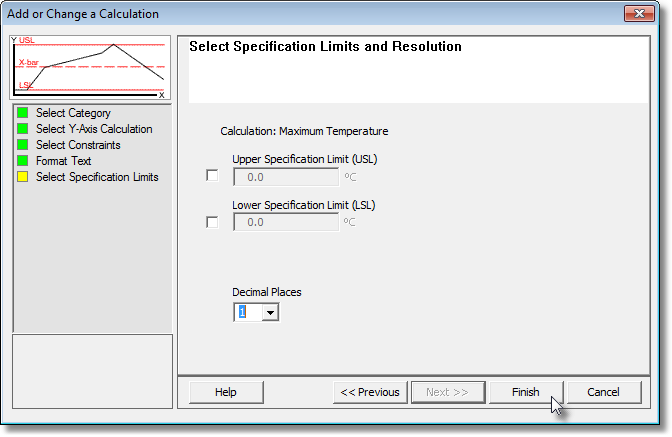
| 12) | Select the Finish command button to complete the wizard and display the new calculation data in the selected template column. |