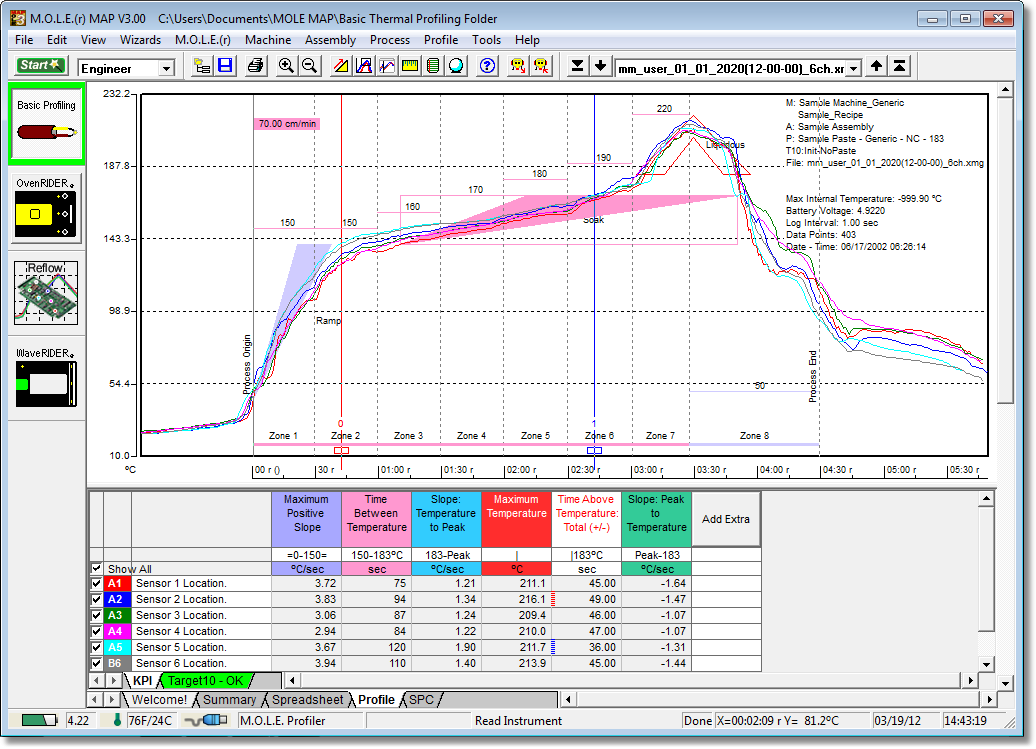
The Data Graph is a display that shows the data collected from the data run overlaid on a graph. The user can analyze and highlight various process features with the tools listed below.
|
The features associated with the Data Graph can be used when in Engineer mode. They can only be viewed when in Verify mode. |
.png "Important Information")
Data Graph features:
| 8) | Map Data |
The Data Graph features are described in the sections that follow. Some of these features are also controlled using the appropriate menu options. Refer to Software>Menu and Tool Commands for more information.
|
|
.gif "Visual Tutorial")